
Tags
As your volume of studies grows, keeping data organized is essential for quick analysis and internal reporting. The tagging system provides a flexible way to categorize your studies, allowing you to filter the Studies Grid and compare insights across tags: use it for example to find specific product lines or timeframes.
Using tags transforms a simple list of studies into a structured database. By implementing a consistent tagging strategy, your team can:
- Segment Insights: Group studies by their product segment och categories to compare how willingness-to-pay differs across categories. For example, a leather company might use "Handbags", "Belts" and "Glowes".
- Track Campaigns: Label studies with specific marketing or launch names to measure the price elasticity of new initiatives, e.g. "Discovery", "Q1 Launch" or "GTM 2026".
- Organizational Reporting: Quickly surface all studies relevant to a specific department or product manager using the grid filters, for example "Sales", "Marketing" or "Product".
Creating and Assigning Tags
Tags are company-wide. Once a tag is created by any user, it becomes available for everyone within your organization.
During Study Setup
When creating a new study, you can assign existing tags or create new ones directly in the create flow. This ensures every new project is categorized from the start.
Managing the Tag Library
You can create, edit, or delete tags in three primary locations:
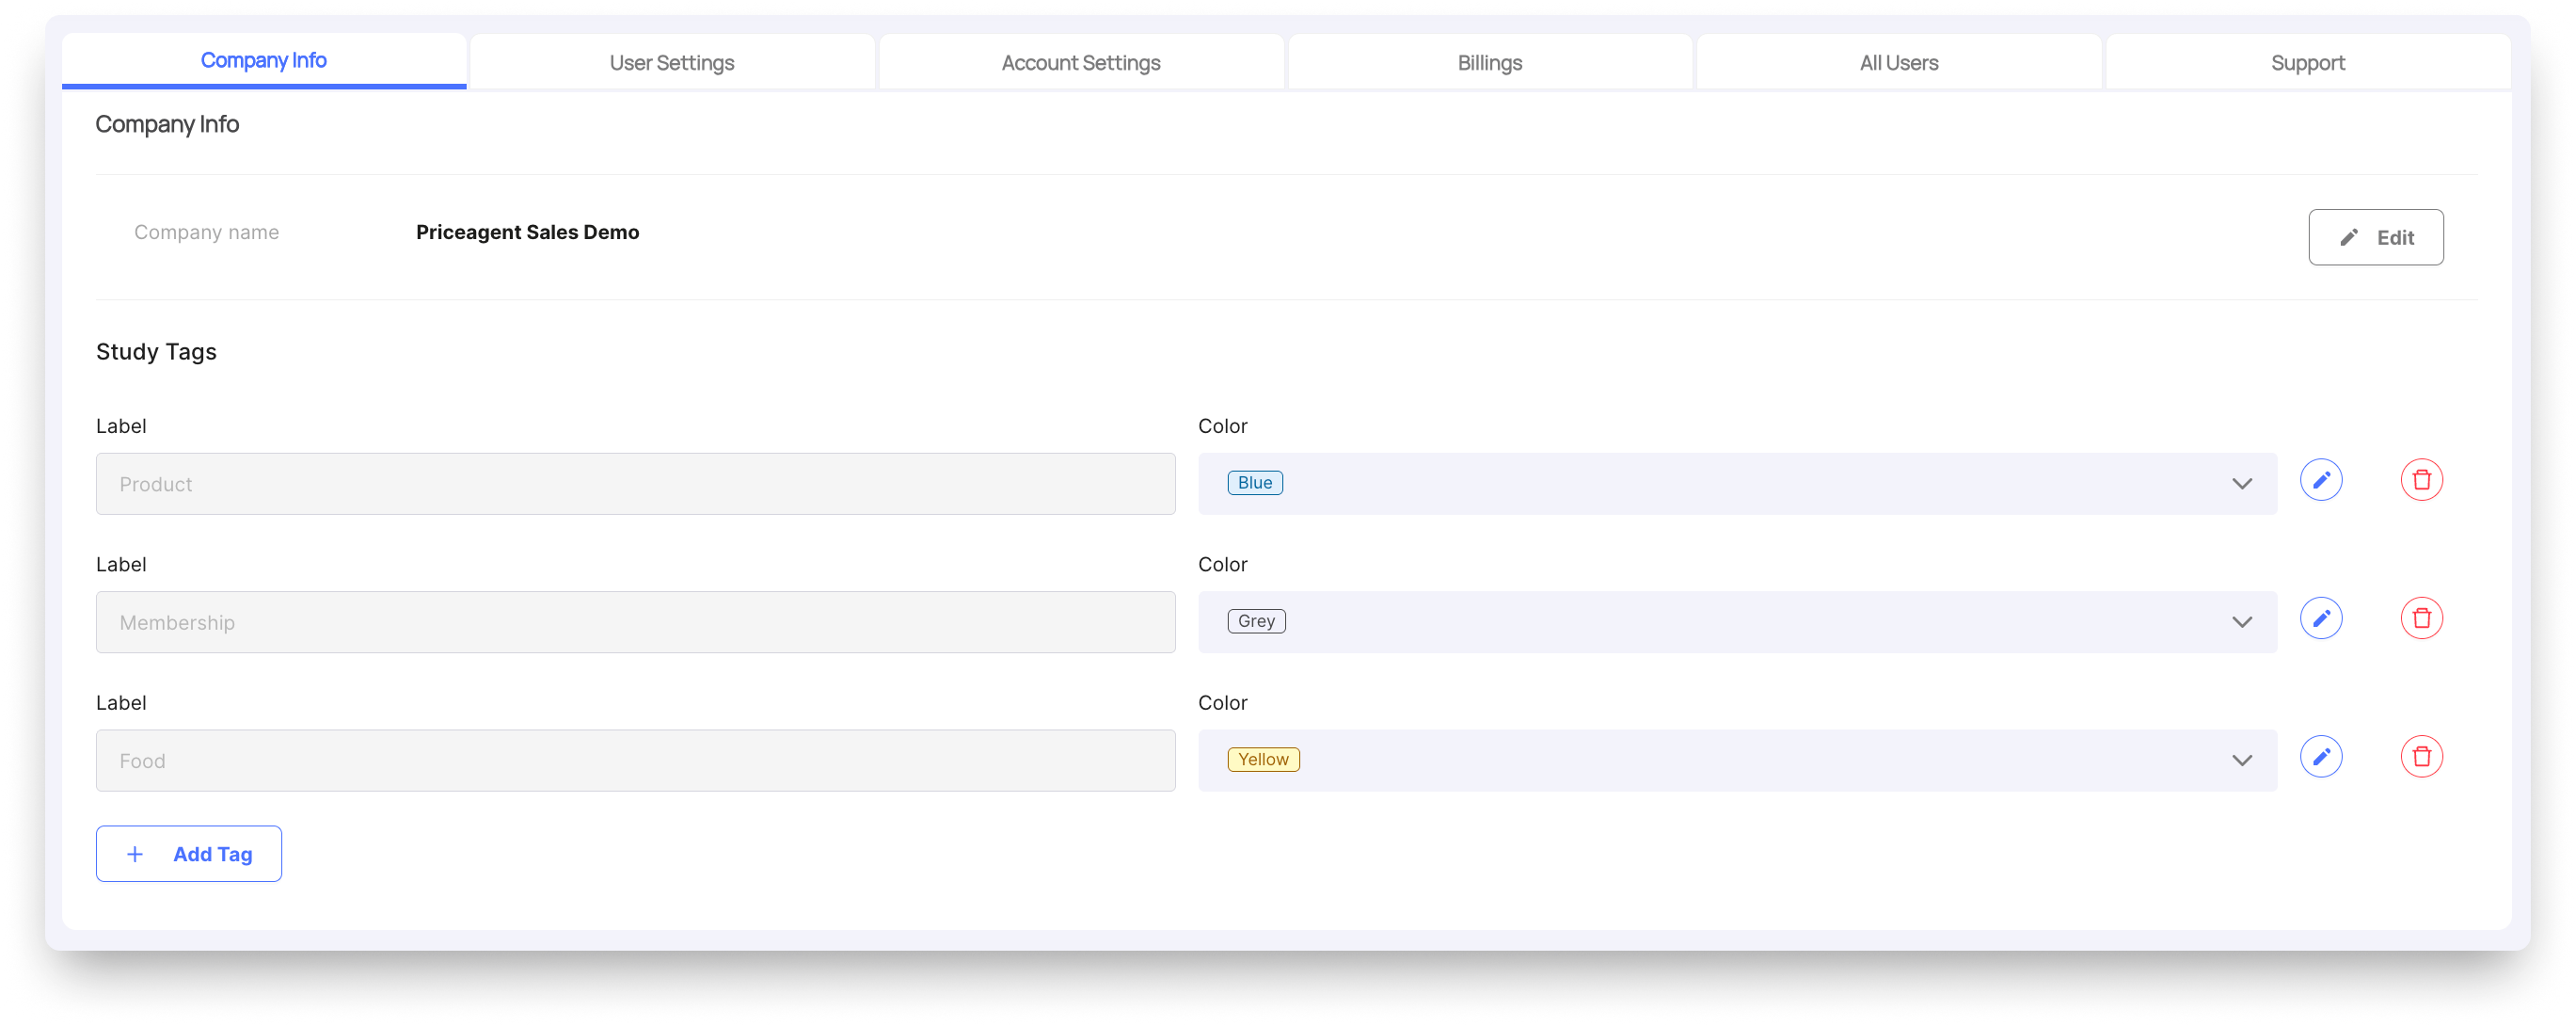
- User Settings: Navigate to the "Manage Tags" page for full administrative control over your company's tag list; editing, deleting, or adding new ones.
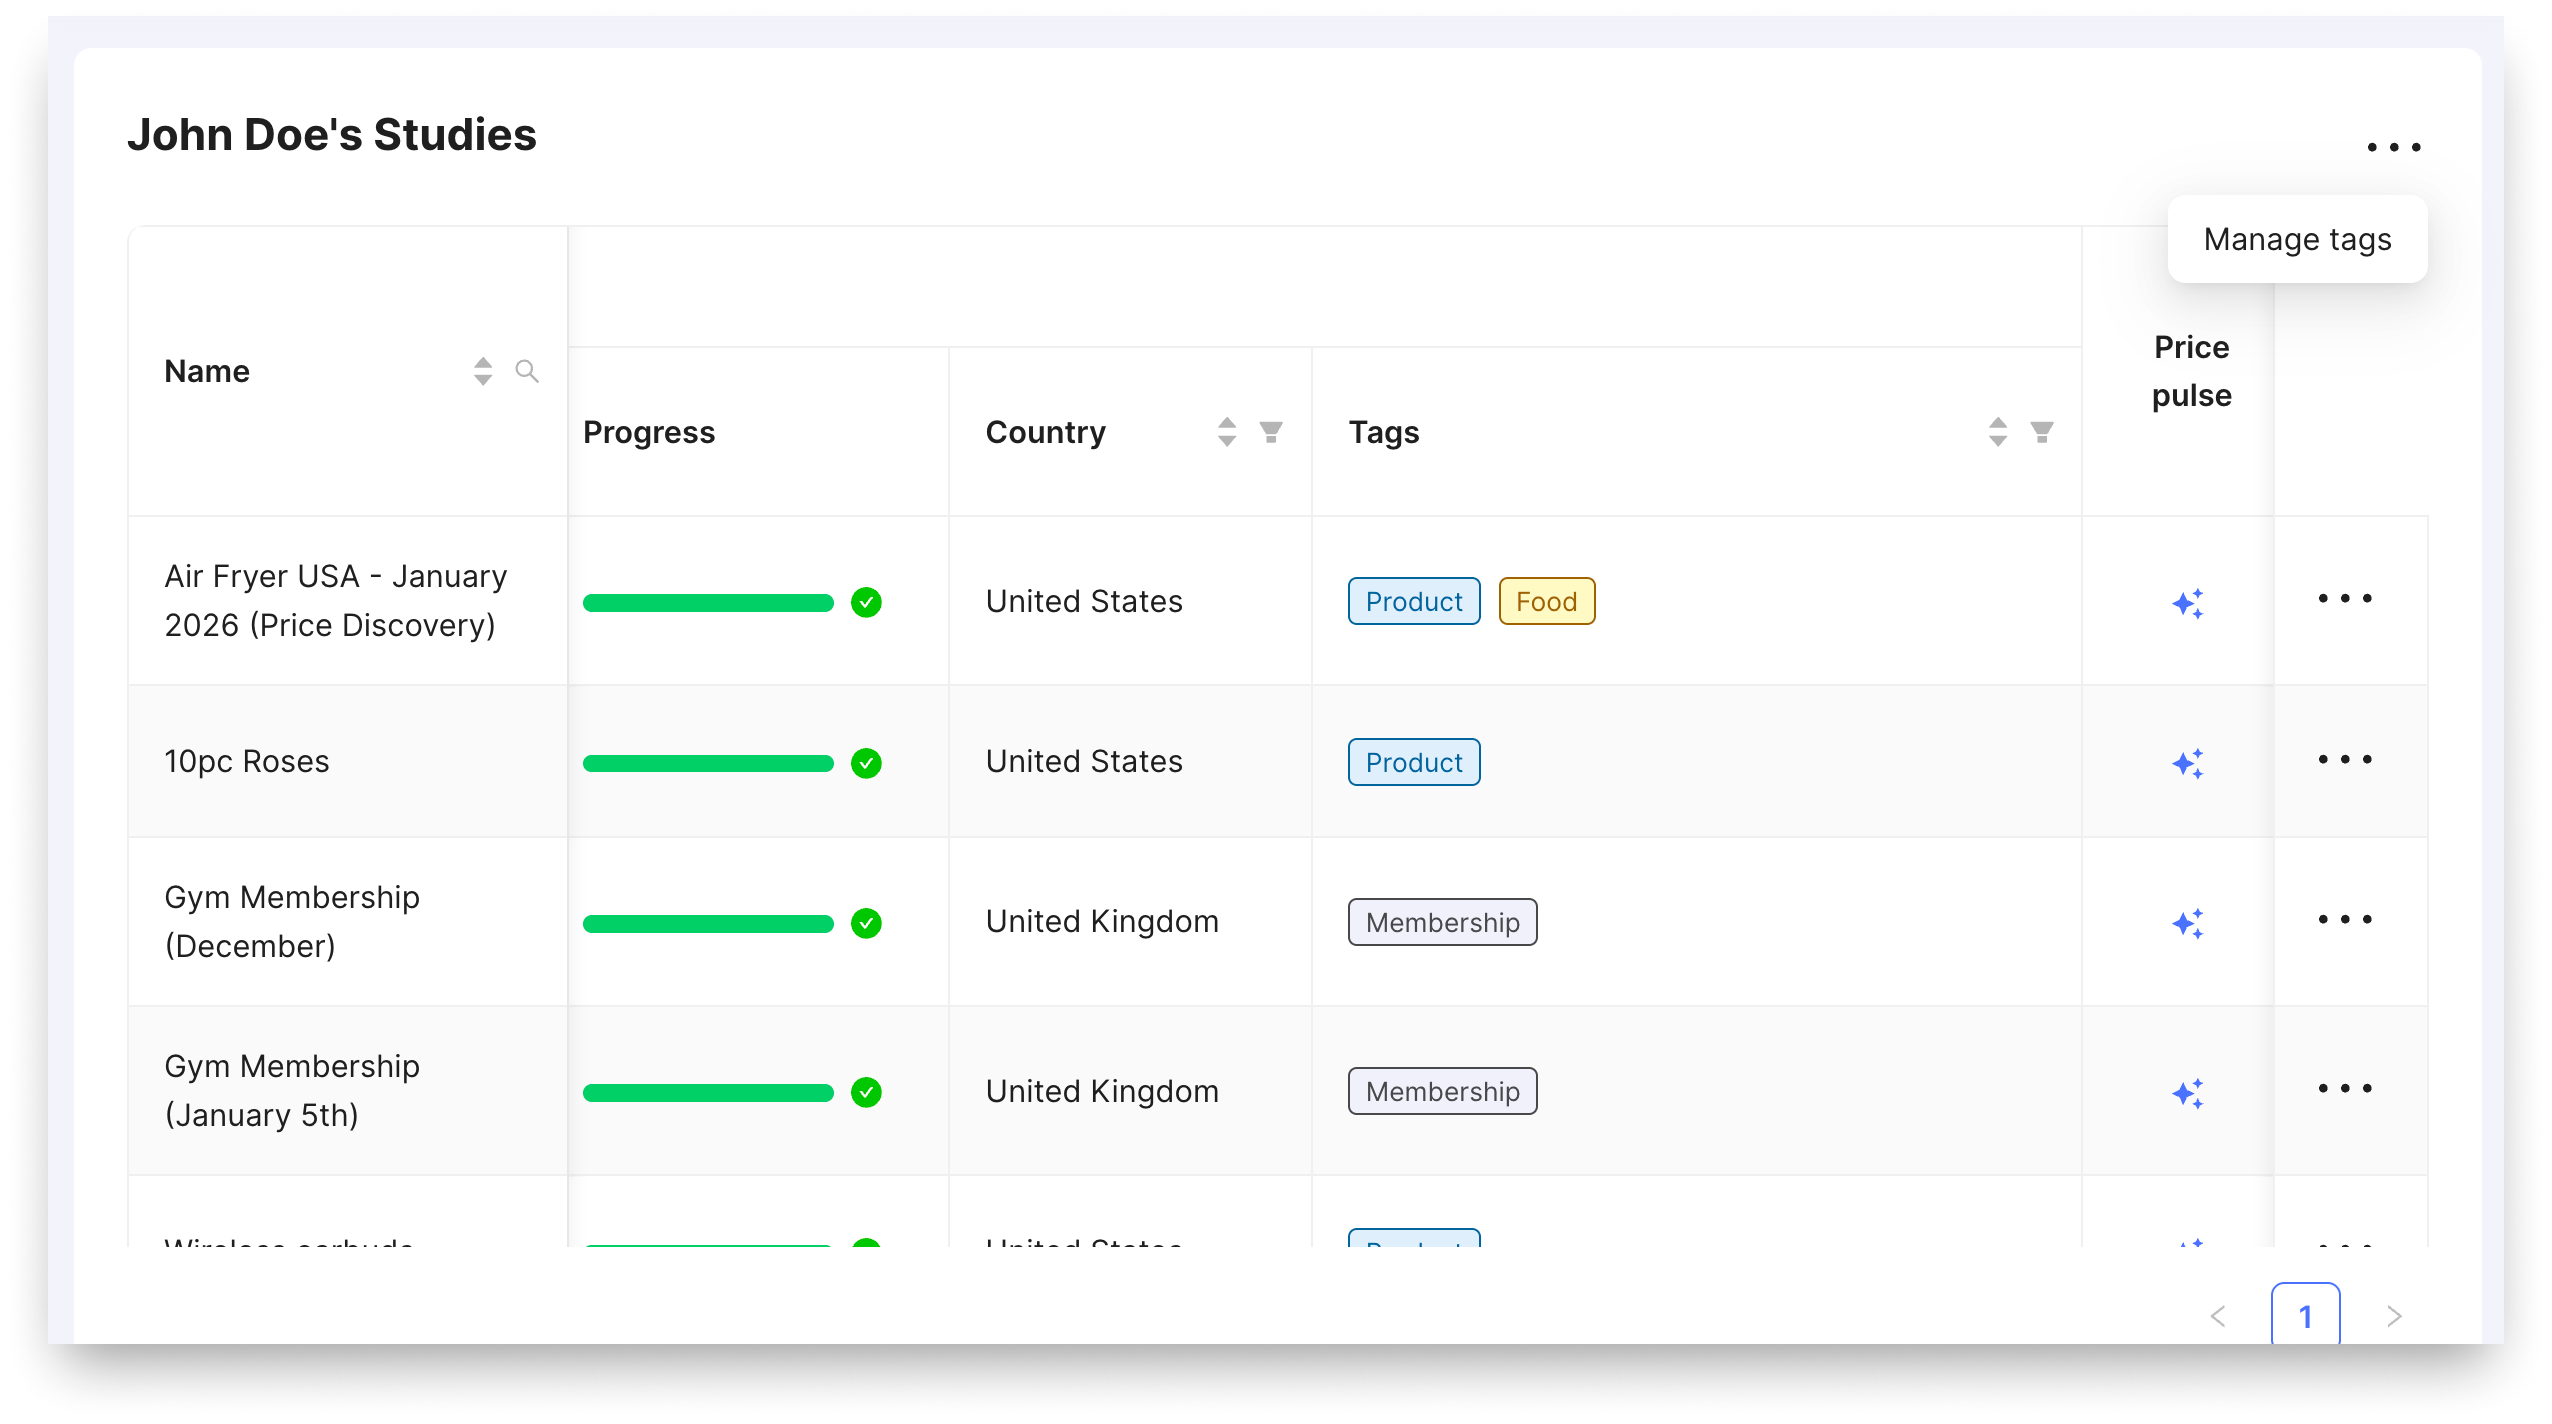
- Study Grid: Add or remove tags for a study by ckicking "more" and "Edit Survey Info". To manage your tags library, click the more button above the grid and "Manage Tags".
- Study Details: Use the "Edit Survey Info" dialog within a specific study to update its tags.
Constraints
- Tag Limit: Each company can store up to 50 unique tags.
- Character Limit: Tags are limited to 20 characters to ensure they remain readable within the grid view.